THE MORNING LINE
The Wizards Cannot Hold Down the Dollar
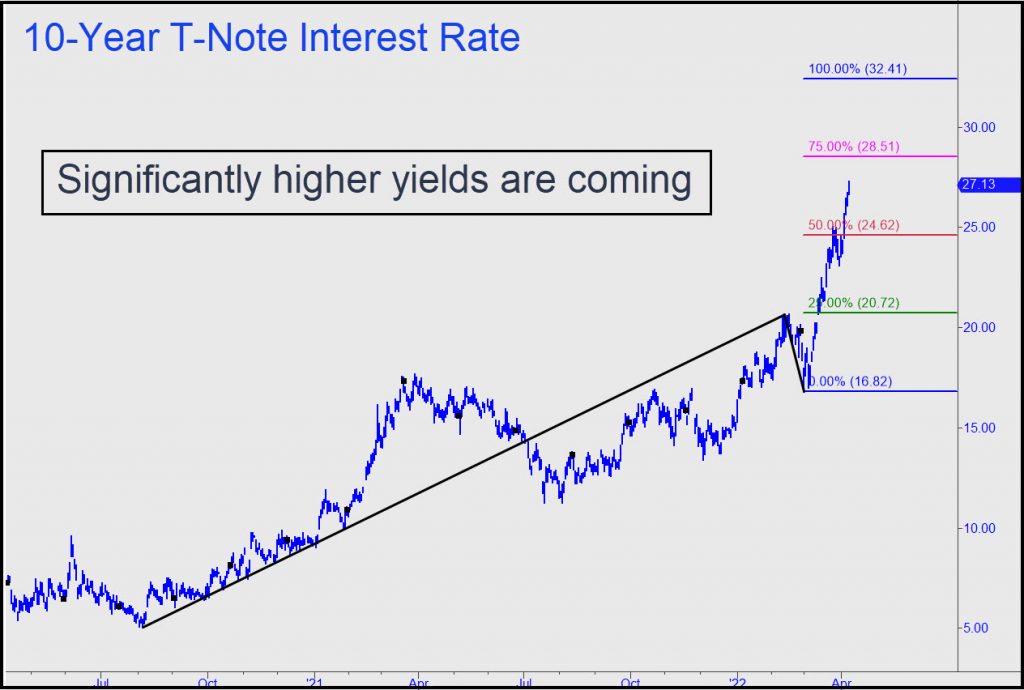 For more than a year, I’ve recommended what my friend Doug Behnfield calls the ‘barbell strategy’ to secure one’s nest egg against the deflationary hard times that lie ahead. As formulated by Doug, a wealth-management advisor based in Boulder, the barbell portfolio is constructed with gold and bonds as offsets. Try to imagine the worst of times and you may have difficulty concocting a scenario in which T-Bonds and munis on one hand, and gold on the other, would fall together. However, it is relatively easy to imagine circumstances in which either or even both sides of the hedge would rise in times of extreme economic adversity.
I had suggested holding off on the T-Bond portion of the hedge until interest rates peak. That day is coming, probably sooner than most ‘experts’ think, but we are not quite there yet. Yields on the Ten-Year Note ended last week at 2.71%, but my forecast calls for a top, or at least a lengthy leveling off, at exactly 3.24%. This is somewhat higher than the 3.02% rate I’d projected for the 30-Year T-Bond, the difference lying in the way their respective rallies have unfolded. For purposes of optimizing the barbell hedge, however, I’d suggest using the 3.24% rate indicated in the chart above.
No More Volckers
A top at that level would be a far cry from the 20% peak in June 1981 that followed two years of tightening by Paul Volcker. As a result, inflation remained subdued for more than 30 years. The effects of tightening this time around could not conceivably turn out to be as benign as before because the debt sums affected are exponentially larger. To cite one particularly menacing example, Third World debts amounted to perhaps $1.5 trillion in the mid-1980s. This sum was deemed sufficient to topple the global banking system if something were not done about it. In the end, nothing was done about it. The debts were simply papered over, providing a fresh foundation for untold heights of indebtedness that currently total more than $2 quadrillion. That number includes the notional value of the world’s chief instrumentality for borrowing — i.e., a financial-derivatives market that has supplanted trade in actual goods and services as the planet’s main line of business.
If you’re worried that Powell & Co. will keep raising rates higher and higher until inflation has been ‘tamed,’ the good news is that these charlatans will never get the chance. The bad news is that a bear market in stocks will intervene well before then, not only quelling inflation, but setting in motion a deflationary implosion that will cause even 2%-3% rates to asphyxiate all who have borrowed in dollars. The list implicitly includes virtually everyone on the short-dollar side of the derivatives market.
Oil Just a ‘Warm-Up’
The rise in oil prices is a warm-up for this catastrophe, since the world is having to pay for energy with increasingly valuable dollars. The wizards who have effortlessly inflated asset values across- the-board over the last two decades are about to discover they are powerless to contain a deflation that will ultimately feed off a strengthening dollar and a corresponding increase in the real burden of debt. The size of the dollar market dwarfs even bonds, repos and swaps put together, a Frankenstein monster energized by lighting bolts that policy tinkering cannot divert.
Rick's Free Picks
$ = Actionable Advice + = Open Position
$ESM22 – June E-Mini S&Ps (Last:4397)
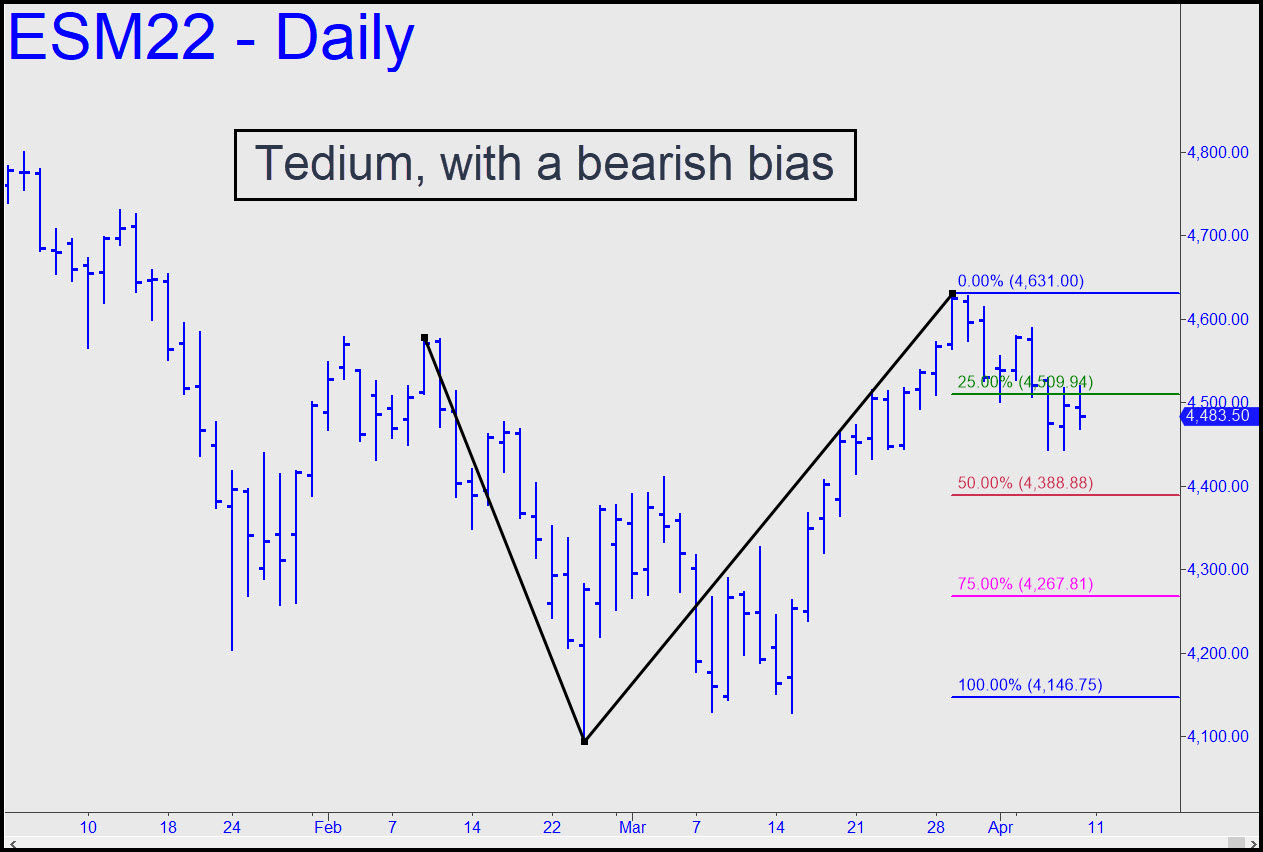
Did you get Mr. Market’s little joke last week? Although angst over the Fed’s plan to tighten until the cows come home stirred up a shitstorm of commentary and fearful headlines, the stock market acted like it was reliving a quiet week in 1955 under Eisenhower. For those who bet on volatility, it was like watching the croupier rake in all the red/green bets when zero has come up on a roulette wheel. The 4146.75 target shown remains my worst-case for now, and the pattern still looks serviceable for getting short on the way down. Don’t pass up an opportunity
TLT – Lehman Bond ETF (Last:125.12)
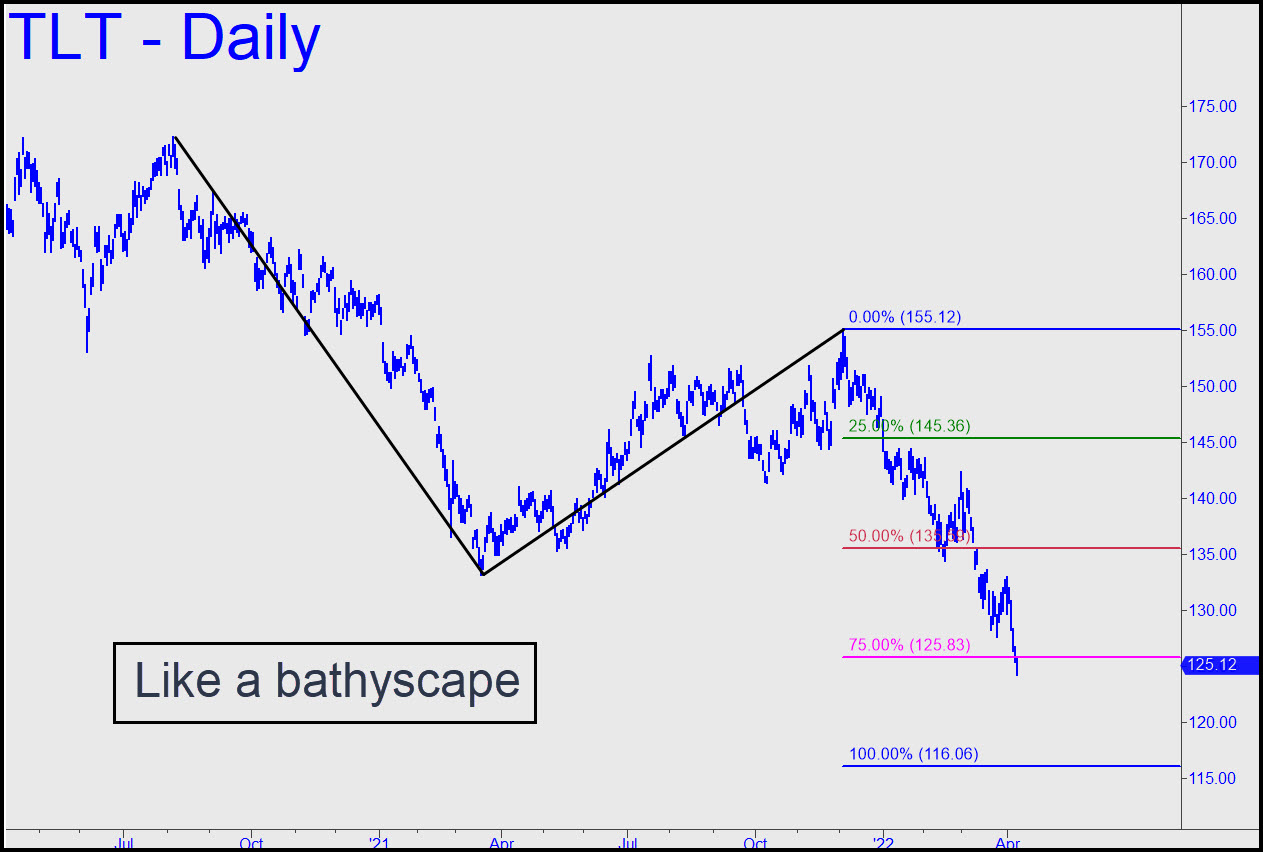
The 116.06 downside target seemed farfetched when it first came into play theoretically back in January. However, with Friday’s plunge through p2=125.83, it has become no worse than an even-odds bet to be achieved. The pattern looks a little too obvious to yield up a bottom-fishing gem for us. Indeed, as a practical matter I’ll be look for the Big Turn to occur in the discomfort-zone void between p2 and D=116.06. For now, however, unless you’ve been trading this vehicle all the way down, I’d suggest continuing to gape in awe.
$GCM22 – June Gold (Last:1945)
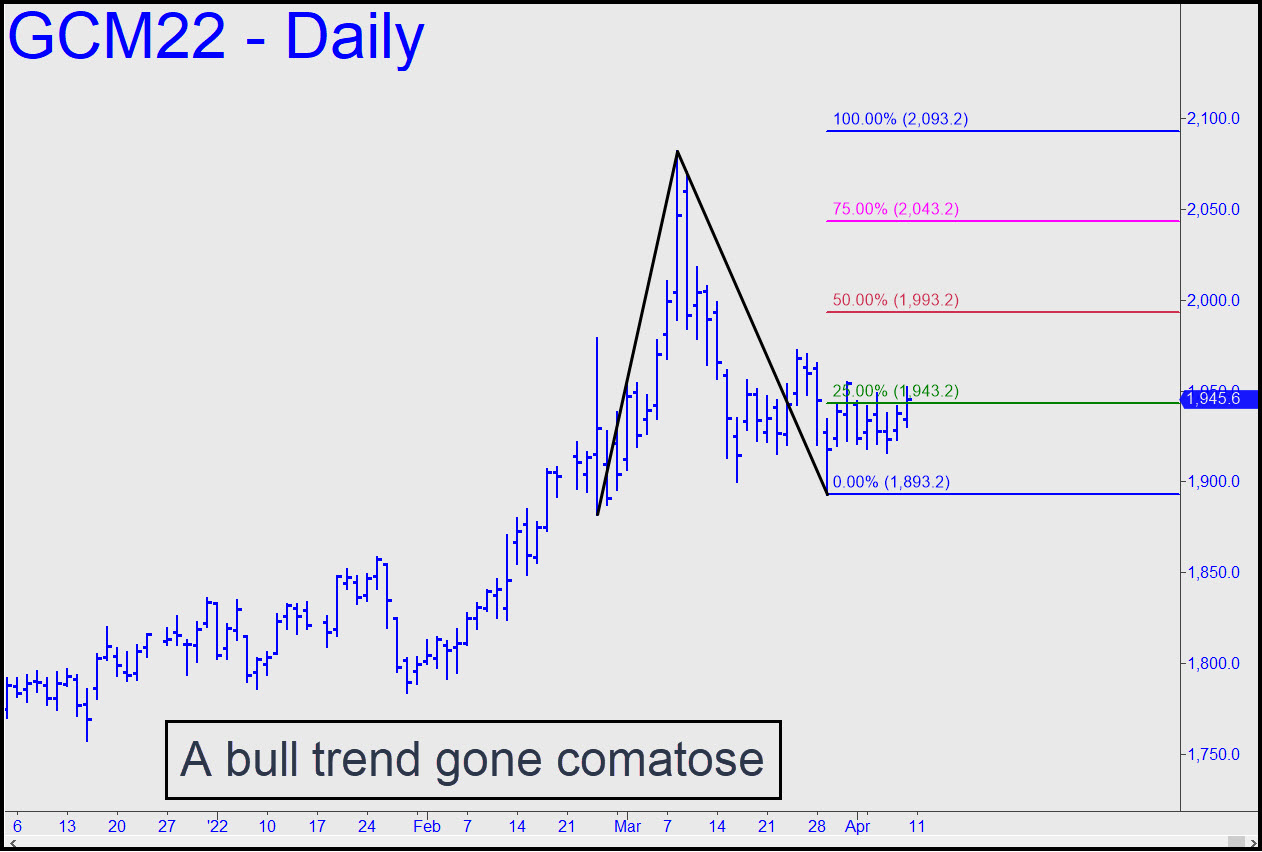
The bull trend begun in February has gone comatose along with the stock market. The timing of the breakout is unpredictable, but look for the futures to ascend quickly to p=1993.20 when it happens. The futures could continue to swing gratuitously $40 either way in the meantime, but any trading opportunities thereof would need to come from the lesser intraday charts.
$+CLK22 – May Crude (Last:94.30)
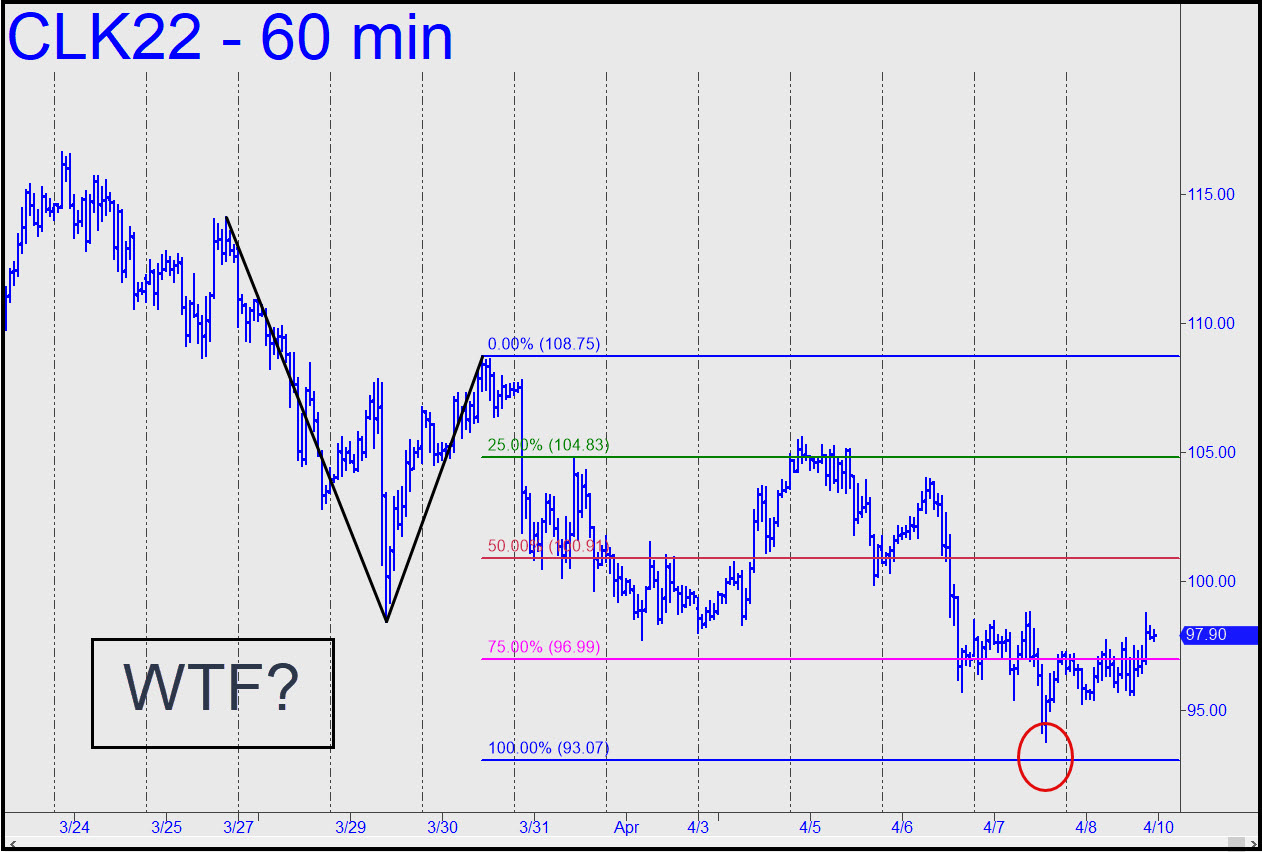
The pattern shown is so wickedly gnarly that I’m surprised last week’s low did not occur within pennies of the 93.07 target. I would be logical to infer that a bottom is in and that the futures are telegraphing strength in the week ahead, and so we shall. But I will also suggest keeping an open mind to the possibility of a relapse to the target, since that would enable us to bottom-fish with risk under very tight control. ______ UPDATE (Apr 11, 9:04 a.m.): Now that’s more like it. The futures did in fact relapse to a 92.93 low
$$TNX.X – 10-Year Note Rate (Last:2.61%)
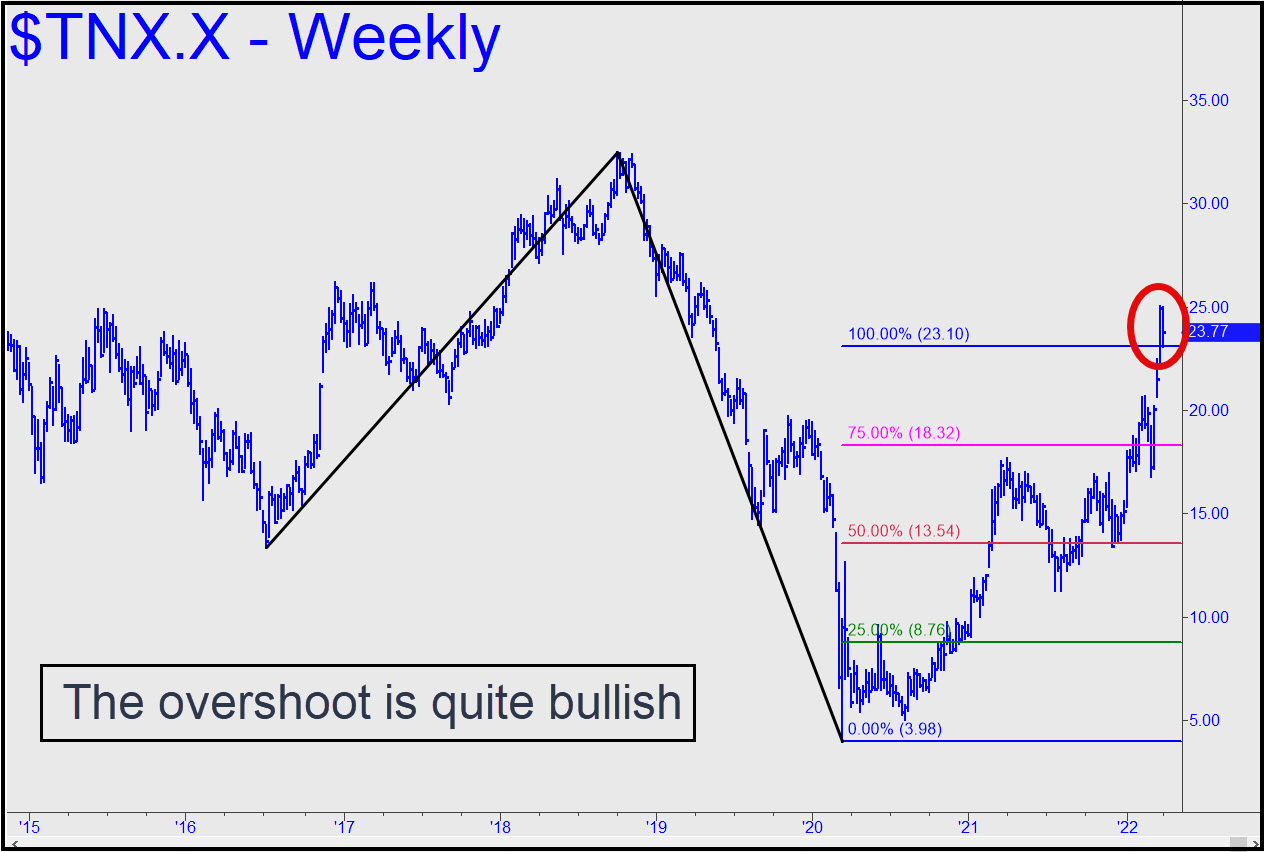
The rally has blown past every Hidden Pivot resistance that might have stopped it, suggesting it has a ways to go. Specifically, the move could reach the 3.22% target shown in this chart. The pattern used to project the target is highly unconventional but legitimate nonetheless, since the point ‘B’ high surpassed some very real ‘external’ peaks from 2019. If the foregoing is correct, the economy is in for quite a bit of pain before a collapse and a bear market snuff inflation for a generation. The stall at p=2.45% could conceivably be the end of the move, but the
$SIK22 – May Silver (Last:25.57)
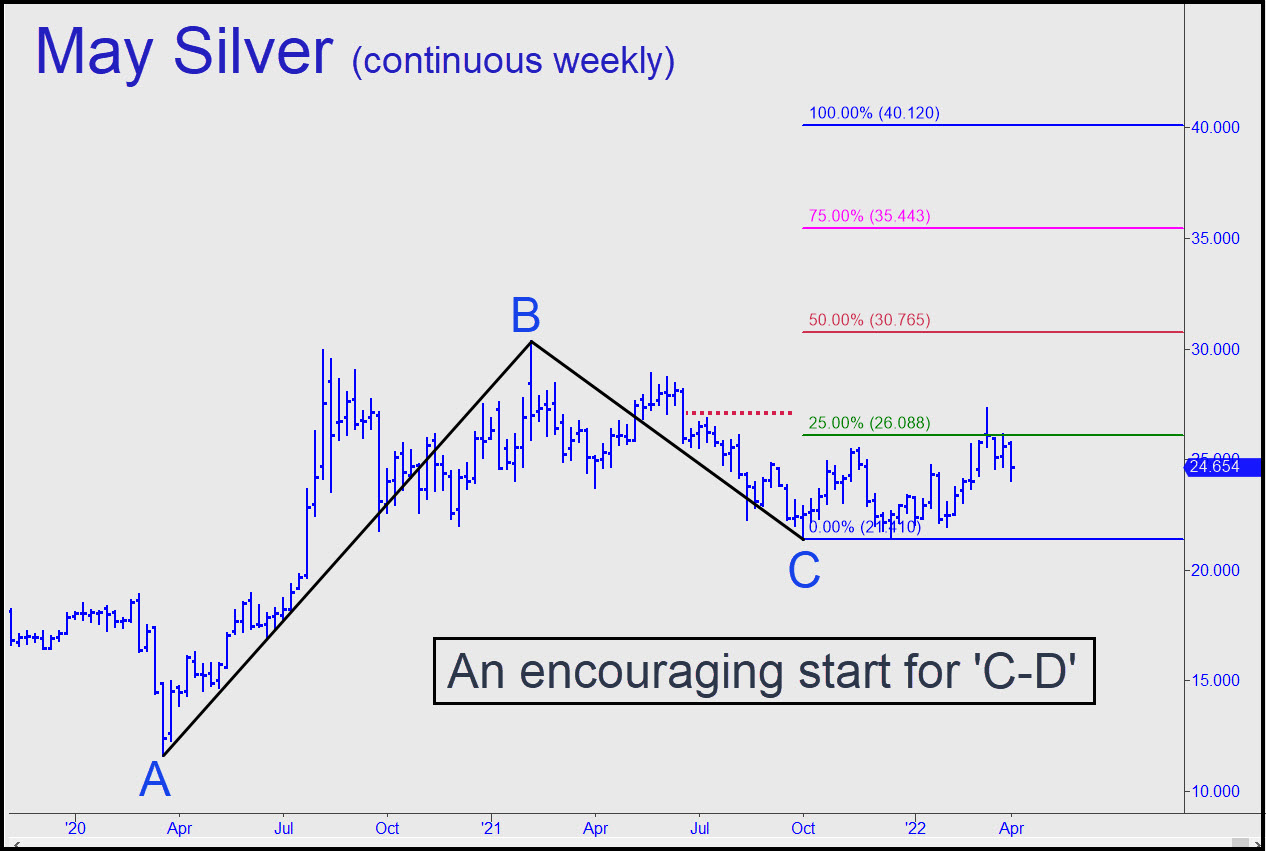
The chart shown in the inset employs the same coordinates I’ve used in June Gold to produce a picture not quite as bullish but still promising. Gold has already poked above its red-line ‘midpoint’ Hidden Pivot, but silver has merely exceeded the green line (x) to signal a rally to at least p=30.76 theoretically. The thing to realize. however, is that the stab higher three weeks ago surpassed an ‘external’ peak, generating an impulse leg of weekly-chart degree that will not be easily reversed. That would require a drop below C=21.41 of the pattern — possible but seemingly unlikely at
Traders use Rick's Picks to slash risk
and boost their win rate:
- 'Uncannily accurate' regular forecasts
- Real-time, actionable alerts
- Invitations to Rick’s live ‘requests’ sessions where he analyzes your favorites
- Timely links to top financial analysts and advisors on Rick’s short list
- Detailed coverage of stocks, options, ETFs, bitcoin, bullion and more
- A 24/7 chat room where great traders from around the world share actionable ideas
- Impromptu sessions to be on top of market shifts
Rick's work has been featured in
What We Offer
Rick’s Picks Subscription
If you are looking for trade recommendations and forecasts that are precise, detailed and easy to follow, look no further-
'Uncannily accurate' technical forecasts
-
Real-time alerts
-
Timely commentary on the predictions of other top gurus
-
Timely links to the world’s top financial analysts and advisors
-
Detailed coverage of stocks, cryptos, bullion,
index futures and ETFs -
A 24/7 chat room where veteran traders from around the world share opportunities and actionable ideas in real time
The Hidden Pivot Course
Learn to trade and reduce risk and stress to a minimum with Rick’s simple, proprietary system.-
Learn the basics in a few hours
-
Hone your skills with weekly tutorials in real time
-
Review all material using our recorded library
-
Train your eye with 7000 opportune chart patterns
-
Perfect your knowledge with a full year’s
access to Rick’s Picks
