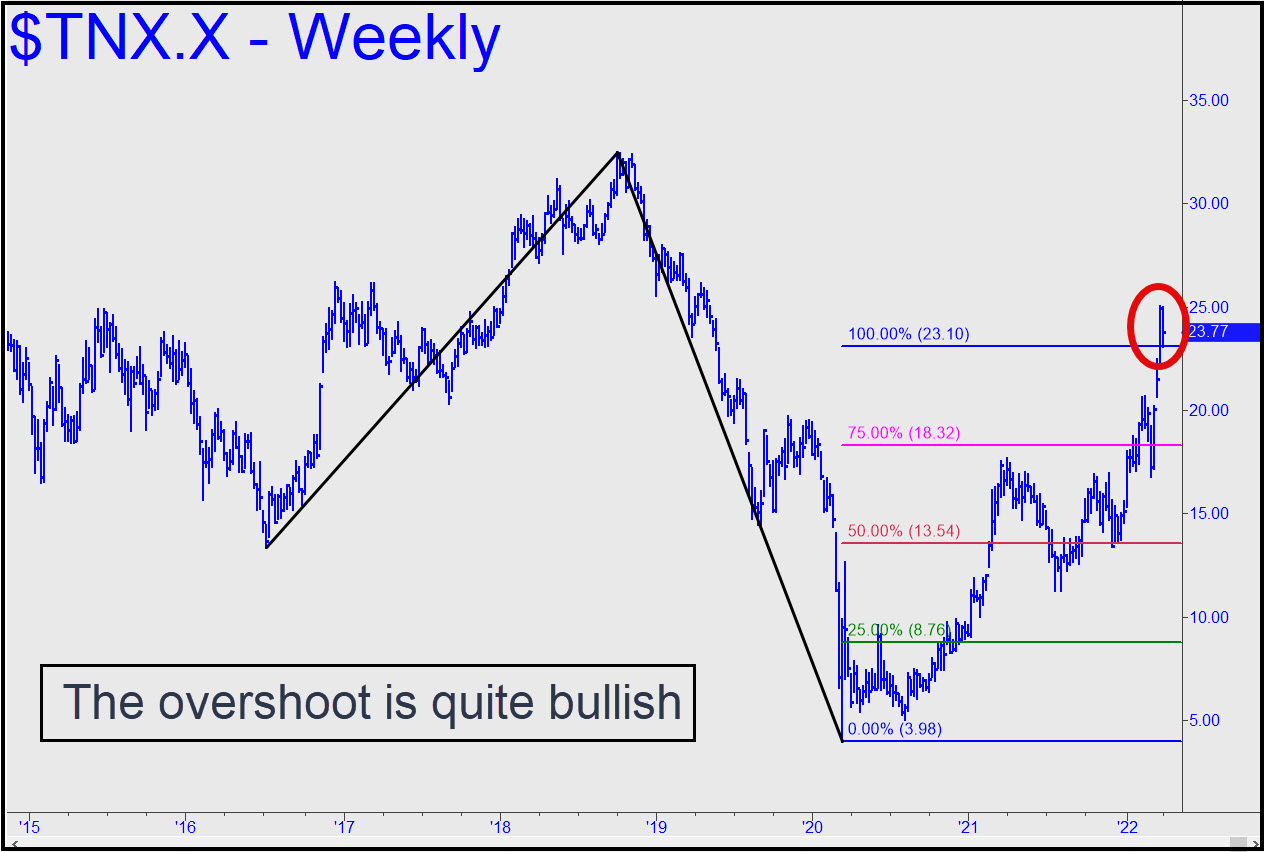
 The rally has blown past every Hidden Pivot resistance that might have stopped it, suggesting it has a ways to go. Specifically, the move could reach the 3.22% target shown in this chart. The pattern used to project the target is highly unconventional but legitimate nonetheless, since the point ‘B’ high surpassed some very real ‘external’ peaks from 2019. If the foregoing is correct, the economy is in for quite a bit of pain before a collapse and a bear market snuff inflation for a generation. The stall at p=2.45% could conceivably be the end of the move, but the breach is already significant enough to presume otherwise. _______ UPDATE (Apr 5, 6:19 p.m.): The rally ripped though p=2.45% today with such force that we can infer that p2=2.83% of the chart linked above will likely be achieved. It is tied to the 3.22% target. [Apr 6 note: My apologies. WordPress failed to publish an update and chart Tuesday night that were intended to take the guesswork out of this rally. Here’s the chart, which shows the provenance of the 3.22% target, now an odds-on bet to be reached eventually.]
$$TNX.X – 10-Year Note Rate (Last:2.61%)
 Posted on April 3, 2022, 5:17 pm EDT
Last Updated April 12, 2022, 12:21 am EDT
0 comments
