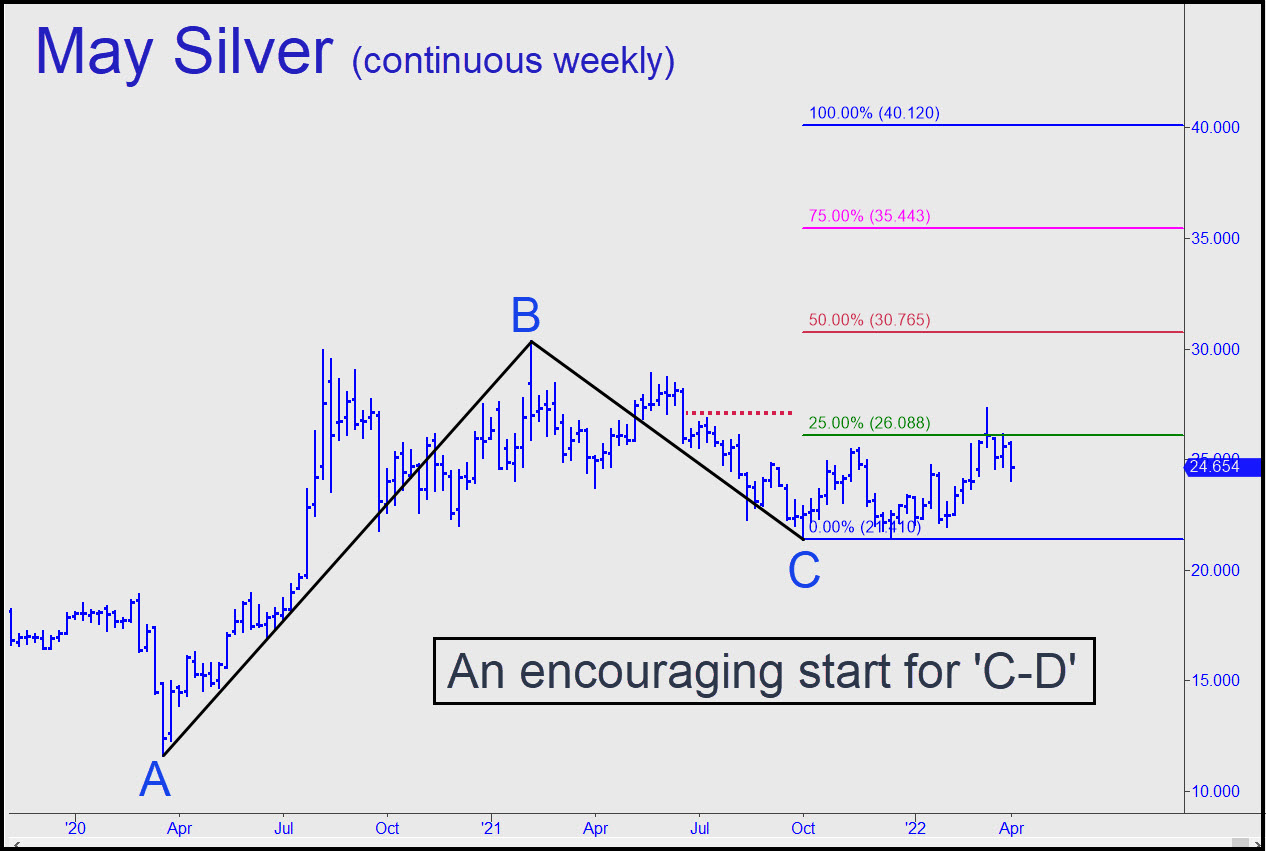
 The chart shown in the inset employs the same coordinates I’ve used in June Gold to produce a picture not quite as bullish but still promising. Gold has already poked above its red-line ‘midpoint’ Hidden Pivot, but silver has merely exceeded the green line (x) to signal a rally to at least p=30.76 theoretically. The thing to realize. however, is that the stab higher three weeks ago surpassed an ‘external’ peak, generating an impulse leg of weekly-chart degree that will not be easily reversed. That would require a drop below C=21.41 of the pattern — possible but seemingly unlikely at this point. _______ UPDATE (Apr 11, 8:30 a.m. EDT): May Silver has finally launched toward the 25.83 midpoint pivot of the pattern shown here. It will serve as a minimum upside projection for the next day or two. As always, an easy move through this ‘hidden’ resistance would portend more upside to the next Hidden Pivot level, in this case the ‘secondary’ pivot at 26.73. ______ UPDATE (Apr 12, 4:52 p.m.): The rally topped out a penny above the 25.83 Hidden Pivot we were using as a minimum upside projection. No one mentioned this in the chat room, of course, but I lack the energy to admonish or cheerlead. Score it as yet one more tree that fell silently in the forest.
$SIK22 – May Silver (Last:25.57)
 Posted on April 3, 2022, 5:14 pm EDT
Last Updated April 12, 2022, 5:02 pm EDT
0 comments
